Posadas [he/him, they/them]@hexbear.net to the_dunk_tank@hexbear.netEnglish · 10 months agoHead Empty. No Thoughtshexbear.netimagemessage-square108fedilinkarrow-up1148arrow-down10file-text
arrow-up1148arrow-down1imageHead Empty. No Thoughtshexbear.netPosadas [he/him, they/them]@hexbear.net to the_dunk_tank@hexbear.netEnglish · 10 months agomessage-square108fedilinkfile-text
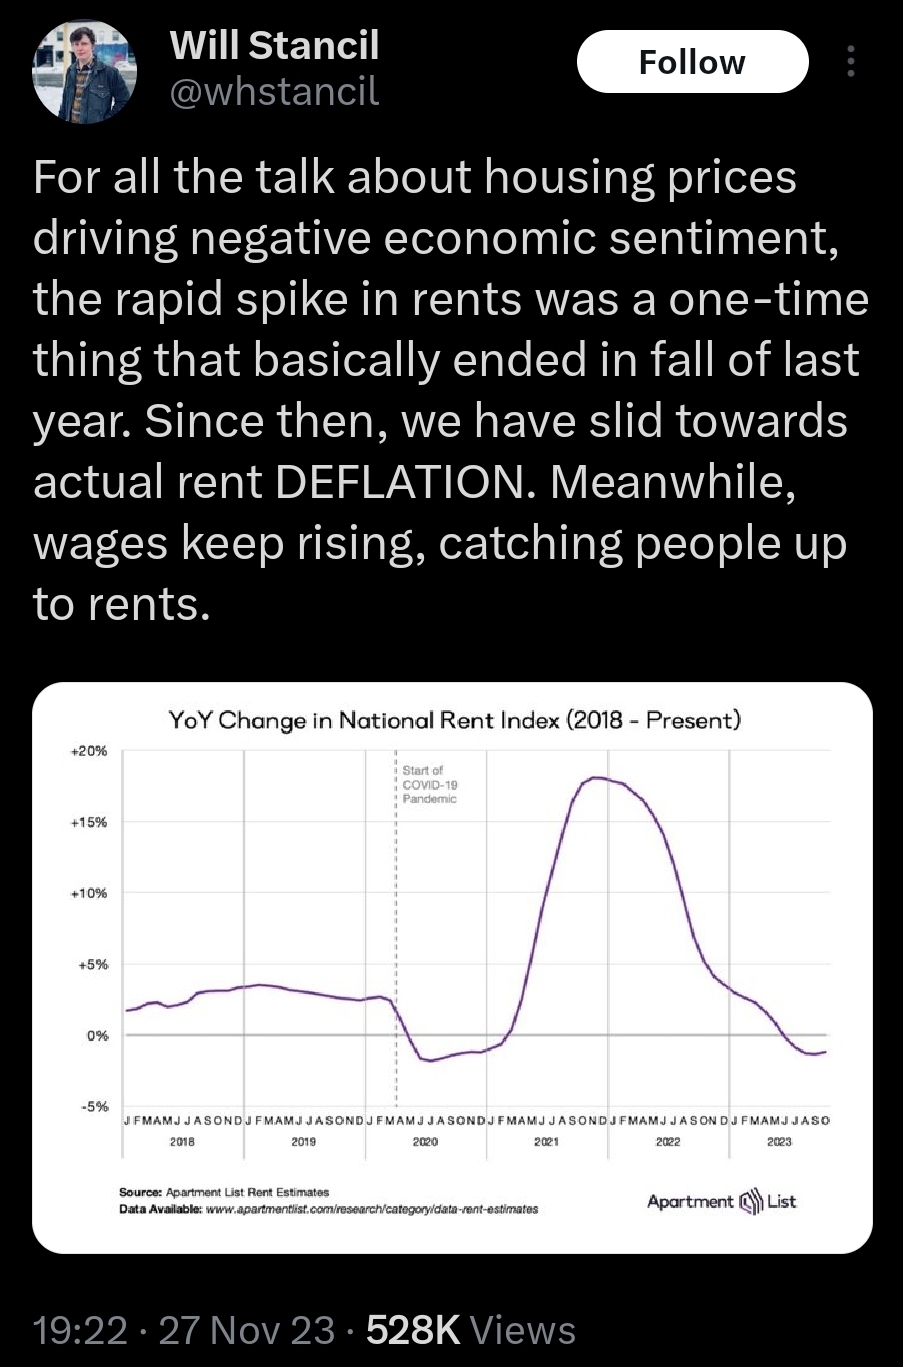
minus-squareDamarcusArt@lemmygrad.mllinkfedilinkEnglisharrow-up17·10 months agoDoesn’t the last little dip show a small decrease? So if in 2020 someone paid $1000 in rent, in 2021-22 it rose by 20% to $1200, then dropped maybe 2% in 2023 down to around $1176 or so. That’s my understanding of it, please tell me if I’m not getting it, math was never something I was great at.
minus-squareRod_Blagojevic [none/use name]@hexbear.netlinkfedilinkEnglisharrow-up14·10 months agoIt looks to me like the chart indicates that recently there may have been some average decrease in rents, but they’ve mostly been rising (sometimes dramatically) over the entire period covered by this graph.


Doesn’t the last little dip show a small decrease?
So if in 2020 someone paid $1000 in rent, in 2021-22 it rose by 20% to $1200, then dropped maybe 2% in 2023 down to around $1176 or so.
That’s my understanding of it, please tell me if I’m not getting it, math was never something I was great at.
It looks to me like the chart indicates that recently there may have been some average decrease in rents, but they’ve mostly been rising (sometimes dramatically) over the entire period covered by this graph.